
SAVE Package v1.0
DESIGNED TO SUPPORT GBF TNFD SBTN CSRD E4 NPI

WHO USES SAVE
Biodiversity assessment has historically been bespoke, slow, and difficult to compare across sites. SAVE creates one science-grade foundation. What changes between users isn’t the data, rather the decision that data has to support.
Corporates
Impact portfolios
Project developers
NGOs
Consultancies & platforms
Government & multilateral
CORPORATES
01
Know what’s actually on your land, before someone else tells you.
SAVE gives every operating asset a defensible, third-party biodiversity baseline on the same scale, so teams can rank risk exposure and act first where the stakes are highest.
HOW YOU USE SAVE
See all ways you use SAVE
Assess your sites
IMPACT PORTFOLIOS
02
Underwrite nature claims with data, not only narrative.
Commission an independent, standardized read on every project at entry and use the same assessment through each reporting cycle.
HOW YOU USE SAVE
See all ways you use SAVE
Baseline your portfolio
PROJECT DEVELOPERS
03
Turn biodiversity co-benefits into something you can verify.
Create a rigorous pre-project baseline and a repeatable monitoring framework, so biodiversity claims use the same standard across the whole pipeline.
HOW YOU USE SAVE
See all ways you use SAVE
Baseline your project
TALK TO US IF YOU ARE
NGOS
Prove the outcome, not just the activity.
Understand the value of your work for the earth with data and use it to prioritize and communicate.
Direct funding toward sites with the greatest importance for species and ecosystems.
Strengthen grants and board reporting with a consistent evidence base.
Discuss program baselines
CONSULTANCIES & PLATFORMS
Deliver assessments at the speed clients expect.
Use SAVE as the standardized data layer beneath site screening, permitting, nature strategy, and disclosure work.
Spend more time on interpretation, strategy, and the client relationship.
Apply a consistent foundation across countries and local teams.
Explore a partnership
GOVERNMENT & MULTILATERAL
National commitments need national-scale evidence.
Use one method from a protected area to a national landscape, without building a different monitoring system for each place.
Baseline restoration zones, protected areas, and priority landscapes.
Direct public and donor funding toward areas carrying the greatest responsibility.
Discuss a program



HOW IT WORKS
SAVE combines modeled global biodiversity data, local pressure layers, and your areas of interest (and can integrate your own field observations) to reveal both ecological importance and where action is most urgent.
INPUTS
Your areas of interest
Sites, projects, portfolios
Map of Life models
Species, ecosystems, pressures
Your local data
Optional field observations

INTEGRATED OUTPUTS
Prevent extinction
SAVE Species
Prevent collapse
SAVE Ecosystems
BREAK SAVE DOWN INTO THE FOLLOWING COMPONENTS:
RESPONSIBILITY
Stewardship
How much of a species’ range or ecosystem’s extent your area supports.

GLOBAL CONTEXT
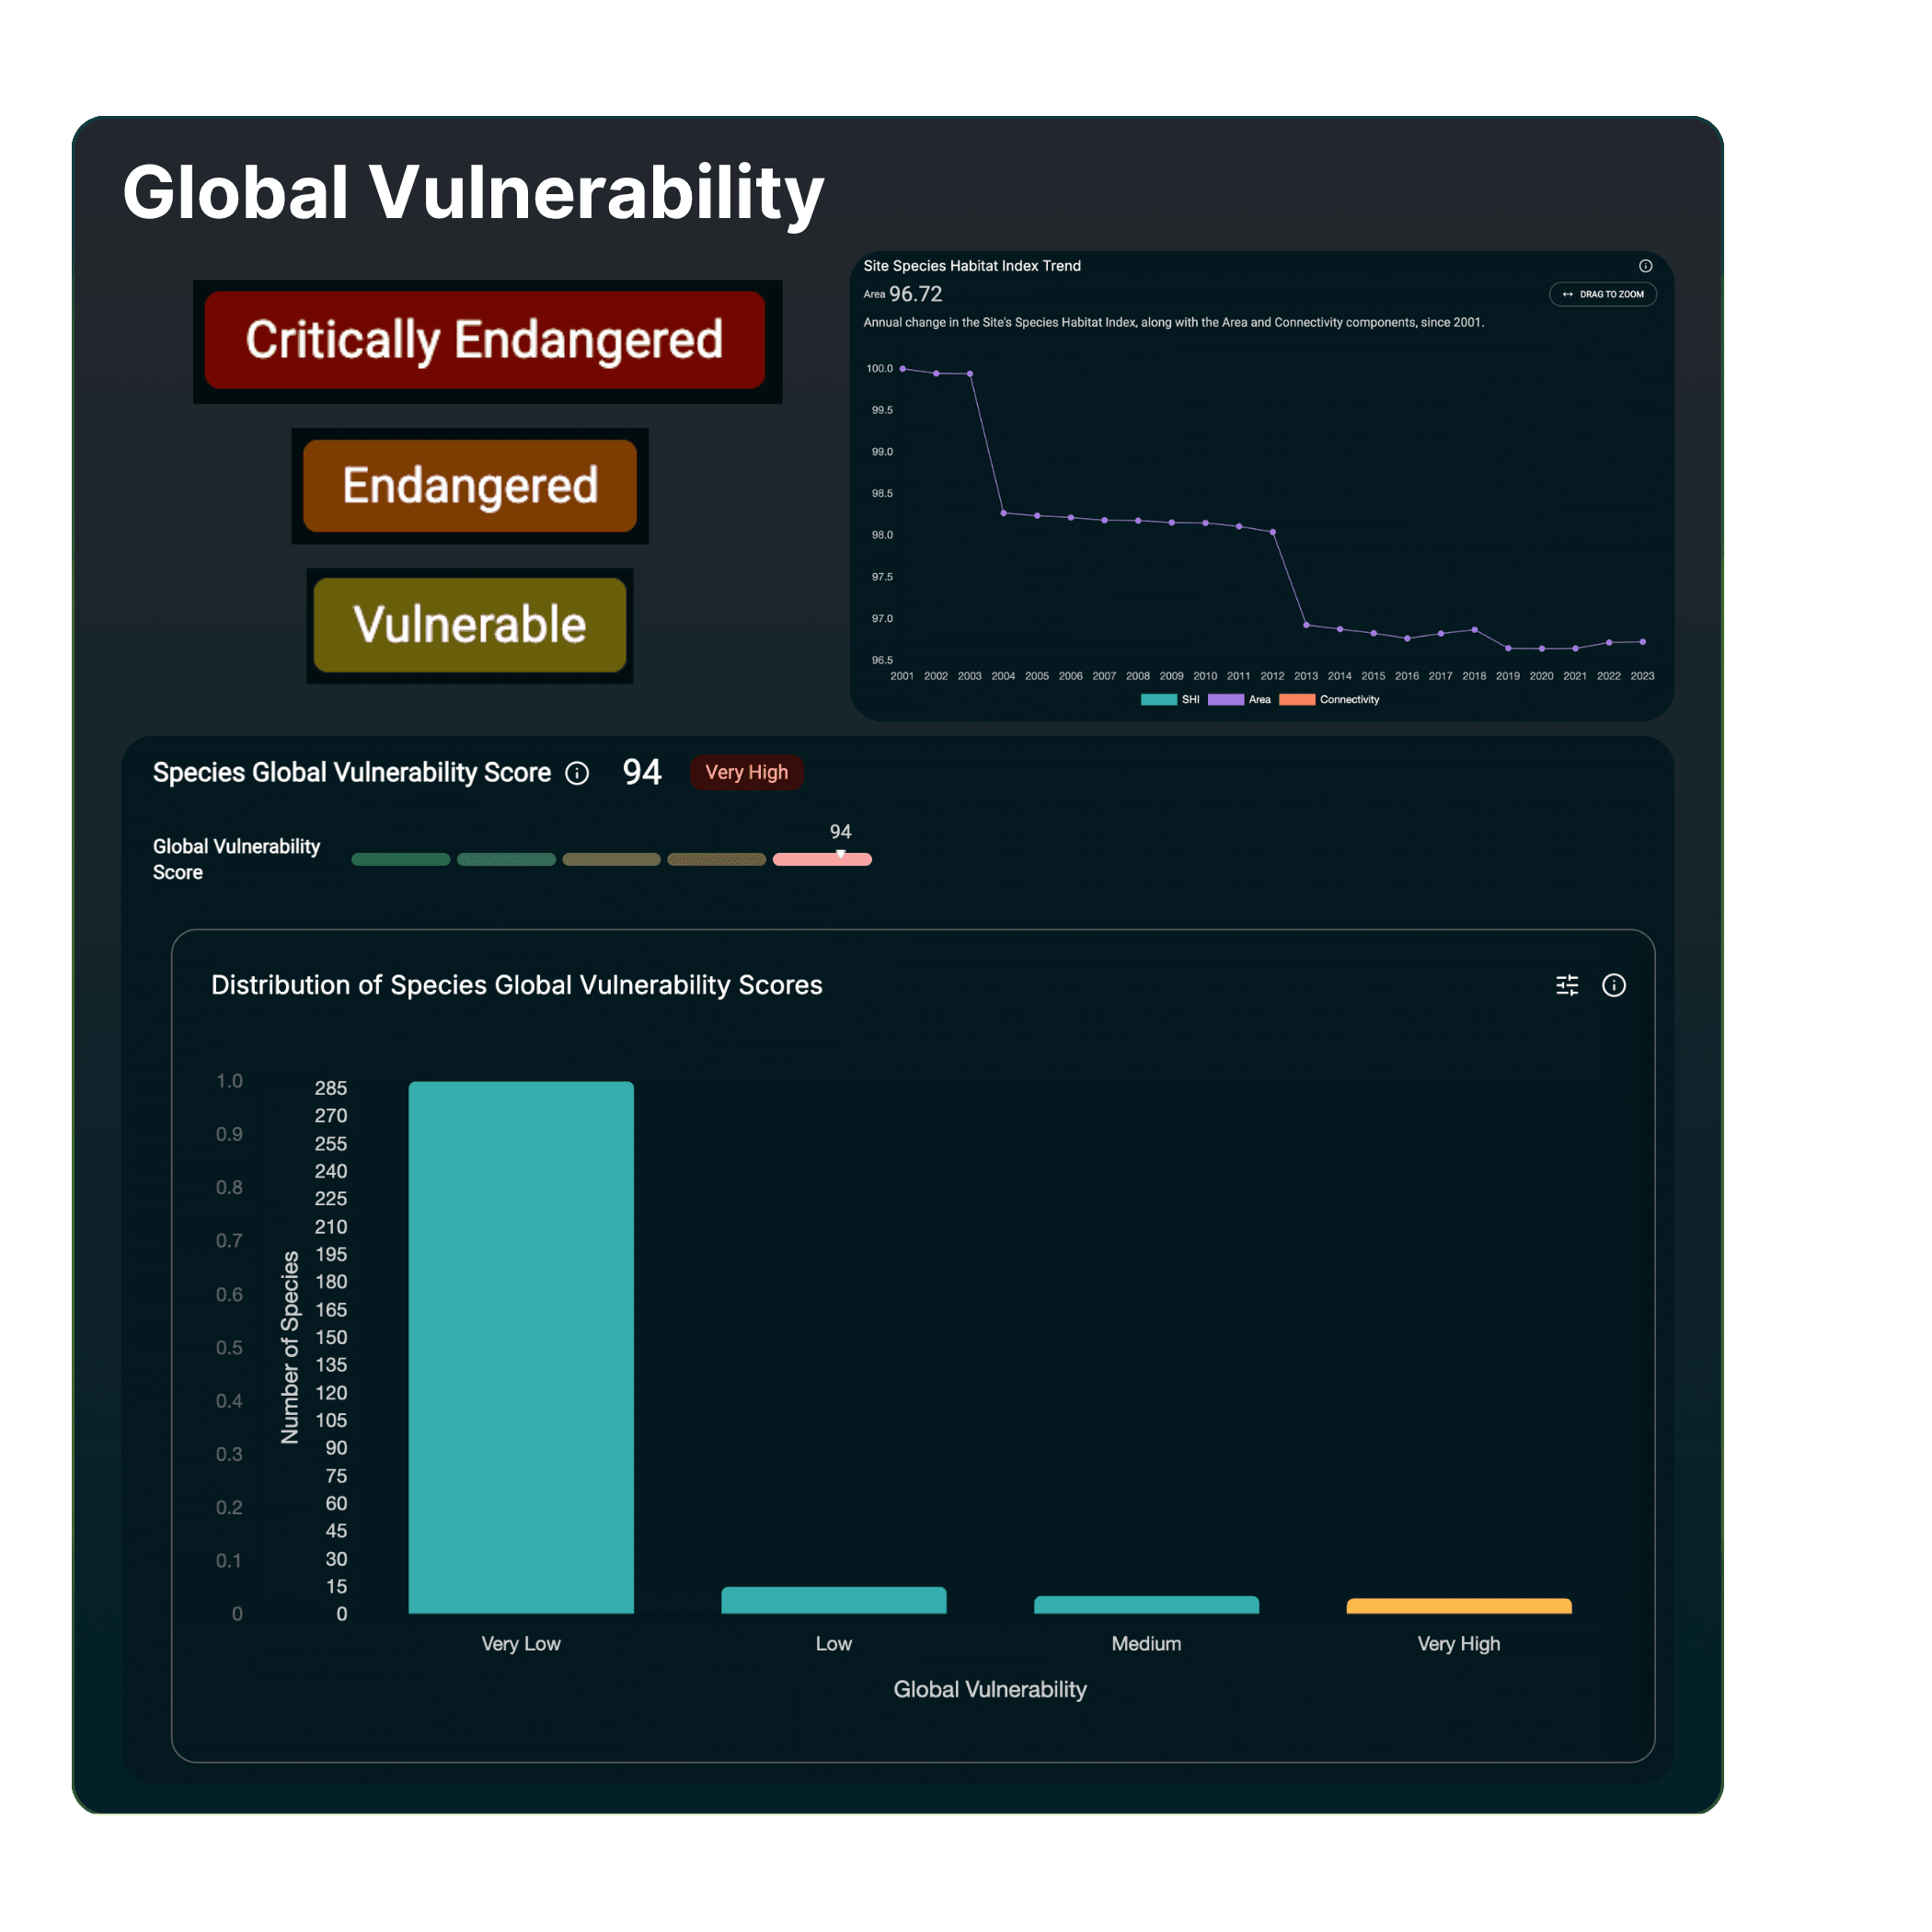
Global Vulnerability
How threatened that species or ecosystem is across its full distribution.
LOCAL URGENCY
Local Vulnerability
How severe local pressures are, considering each species’ or ecosystem’s sensitivity.

SITE LEVEL TRENDS
Species Habitat Index
The historical trend of global suitable habitat area and connectivity for a species, from a 2001 baseline.

GLOBAL SPECIES INFO
Species Data
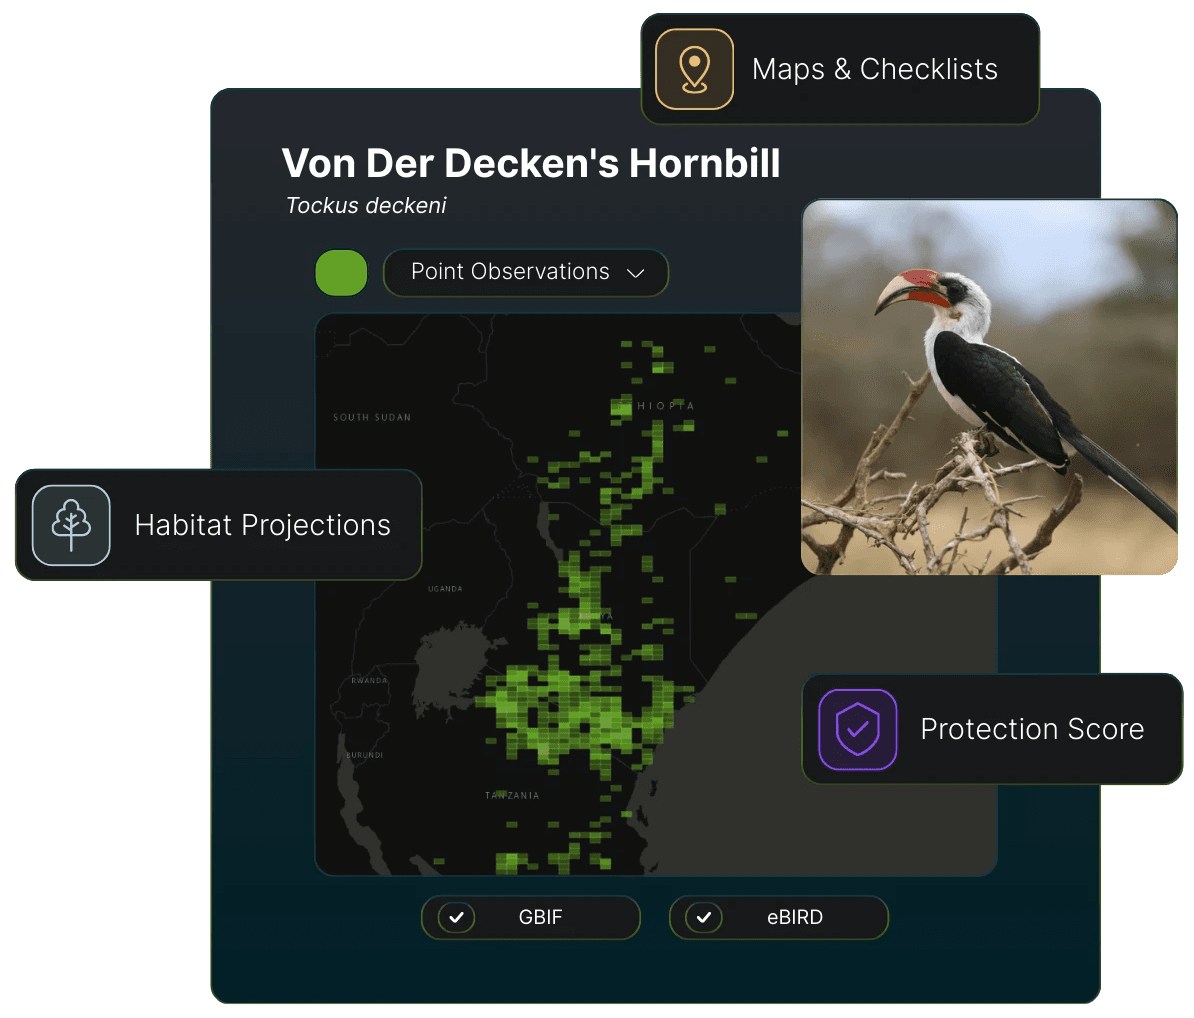
Get species lists, range maps, and information on each at the site, project, or portfolio.
PREDICTION REFINEMENT
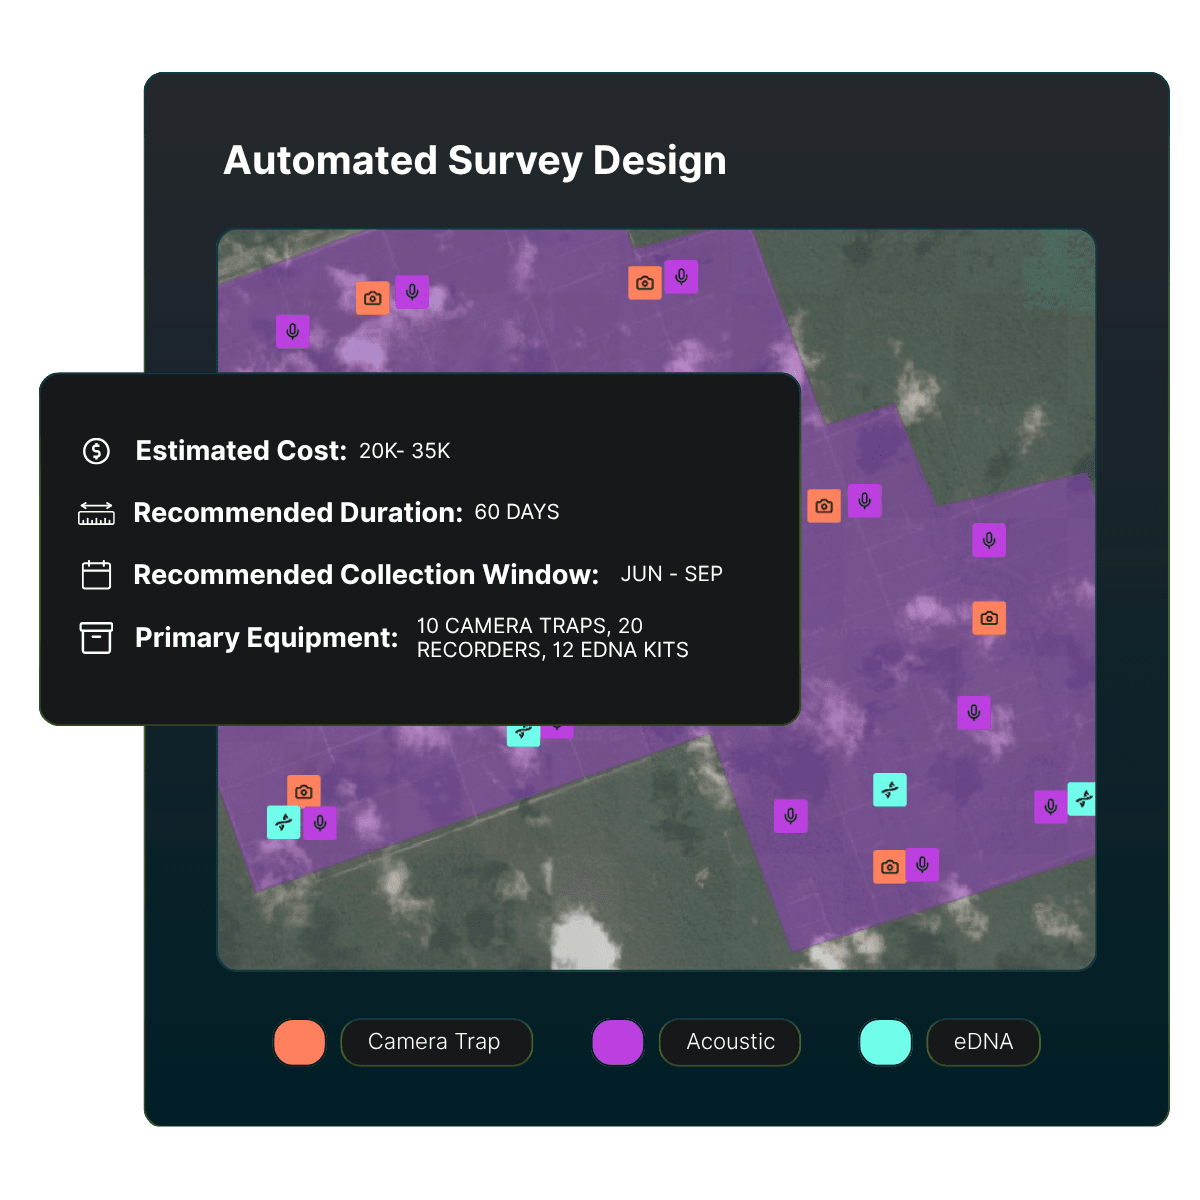
Your Local Data
Upload your existing data or have surveys designed.
One method.
Every scale.
Every assessment is available at the Species, Site, Project, and Portfolio scales.
Species
Site
Project
Portfolio
AVAILABLE THROUGH
Platform
Interactive interface to explore high level metrics down to the species and ecosystems that drive them.
Workbook
All your data easily structured the way you need it for analysis.
API
Integrate directly into your own systems for analysis, monitoring, and reporting.
TECHNICAL FOUNDATION
What sets SAVE apart.
Methodology and data foundations can be reviewed in the SAVE Package v1.0 Technical Documentation, available upon request.
UP TO DATE
Ongoing data updates
Advanced species models and underlying pressure datasets are updated yearly using the best available data.
HIGH RESOLUTION
1 km² spatial insight
Assessment is provided at 1 km² resolution, with the potential to downscale to 300m and finer.
GLOBAL COVERAGE
Comparable anywhere
Global classifications and consistent datasets support comparison across sites, projects, and portfolios.
PRESSURE CONTEXT
Local action signals
Land use, biological resource use, freshwater withdrawals, and nutrient pollution are evaluated against species and ecosystem sensitivity.
SPECIES COVERAGE
Taxonomic Inclusion
COMPLETE TAXONOMIC COVERAGE AND GROWING

Birds

Mammals

Reptiles

Trees

Butterflies, Ants, Odonates
Amphibians (soon)
STANDARDS ALIGNMENT
One evidence base.
Multiple reporting needs.
SAVE breaks its metrics into traceable components, helping organizations use the same underlying assessment across major nature-related frameworks.
01
TNFD LEAP
The full SAVE metrics system supports the Locate and Evaluate phases of the LEAP Approach, including L4 (Interface with Sensitive Locations) and E1 (Identification of environmental assets, ecosystem services and impact drivers). Component metrics also align with the TNFD Draft Guidance on State of Nature Measurement.
02
SBTN
The SAVE Species and SAVE Ecosystem metrics and their pressure-specific component indicators are fully aligned with the biodiversity requirements of SBTN Step 1b (Value Chain Assessment). These indicators help companies contextualize the local and global importance of their science-based targets for nature.
03
CSRD / ESRS E4
SAVE Species and Ecosystems Scores and their pressure-specific components fulfill the metrics requirements for a) drivers of biodiversity and ecosystem change and b) the state of species, related to extinction risk.
04
NPI
The SAVE Species metric meets the criteria for the draft Species Extinction Risk indicator.
05
GBF
The SAVE metrics provide new tools for governments, civil society, and the private sector to engage in biodiversity-inclusive spatial planning and management (Target 1) in order to prioritize locations for restoration (Target 2) and area-based conservation (Target 3), and to take targeted action to halt species extinction (Target 4).
SAVE increases the feasibility for companies to assess, disclose, and reduce biodiversity-related risks and negative impacts in a globally-standardized way as governments enact new regulations (Target 15).
GET STARTED
Tell us about your sites and we’ll prepare a tailored scope for a SAVE assessment.
• Custom assessment scope within two business days
• Pricing that scales with the number of sites
• Available for any geography and industry
Or email us directly at partnerships@mapoflife.ai
By submitting, you agree to be contacted by Map of Life Solutions regarding your inquiry.